In modern days no one has the time or patients of waiting for a website application to load and load on their device. Now imagine the person in question is a potential customer of your company and facing this issue. Now is a critical time and you need to figure out why the website or application loads slow.
Why is my website slow?
When users access any pages on the website a request goes to the webserver. In the webserver, data is stored in the format of files and directories on the Hard Disk Drive like Disks.
As the server process many data requests, the access time of data accumulates, and retrieving data from the disk becomes slow. To avoid application performance due to disk latency you need to monitor Disk usage and Disk I/O so you can identify which application is causing High Disk I/O.
What is Disk I/O?
Disk I/O refers to read or write operations (usually in KB/s) involved in a physical disk. In other words, it is the speed at which the data transfer takes place between the Disk and RAM. And it was measured in active Disk I/O time.
So Disk I/O enables you to monitor the Read and write task of the Disk or drive in the server. You will get an alert and take necessary actions if the below-mentioned values reach their thresholds limit.
Writes/sec – write operations rate.
Reads/sec – read operations rate.
Busy time – the % time it took for your disk drive to respond to write or read requests when it was busy
Queue length – the total number of requests on disk that are in the queue.
Also read : Difference between HDD Drive and SSD Drive
Also read : Cloud computing concepts technology & architecture
Below we can see how we can check disk I/O performance in Windows OS and Linux?
- Monitoring Linux Disk I/O actions using IOTOP and iostat commands
Type top in the terminal to determine the load on your server. If the output is not adequate, then look at wa status to know the status of Read and Write IOPS on the hard disk.
If you see it is high, then you need to check I/O activity in the server using the iotop or iostat commands. You can monitor disc transactions used by single processes with the iotop command.
Let’s first start with iotop command
Type below mentioned command from the shell:
$ iotop
You will see the following output:
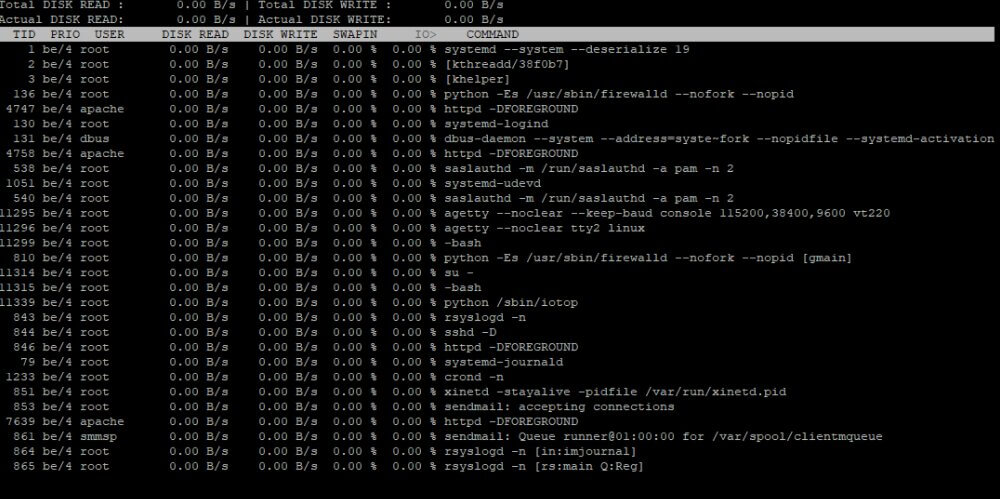
You will get the actual I/O activity, by typing the iotop command with the o option.
$ iotop -o
Output:

iostat command:
You will get each hard disk I/O activity, with the help of iostat command. The screenshots below display 28 and 17 percent disc consumption, respectively.
$ iostat -dx 5
# options #
d : Display the Disk utilization
x : Display extended statistics
5 : Interval in seconds

- Monitoring Windows Disk I/O utilization
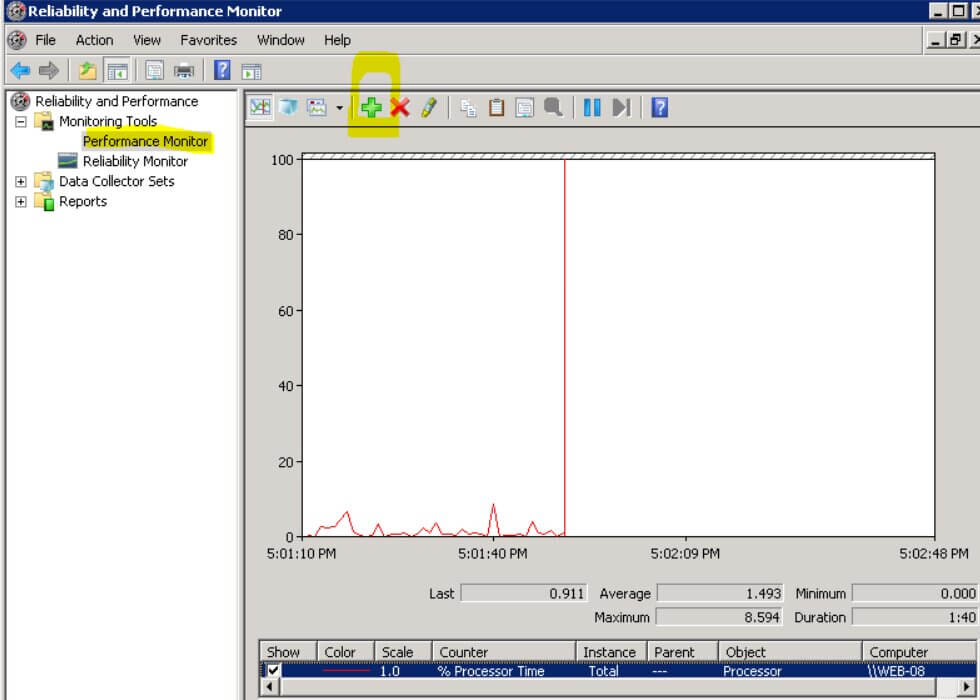
Even you will be able to monitor Windows Disk usage from the Windows Performance Monitoring Tool which is available in all versions of Windows. there are some pre-loaded counters, select all and press the DEL key.

Tap +sign and select the “Physical Disk” from the various “Performance Objects”.
The list of available counters appears as mentioned below screenshot.
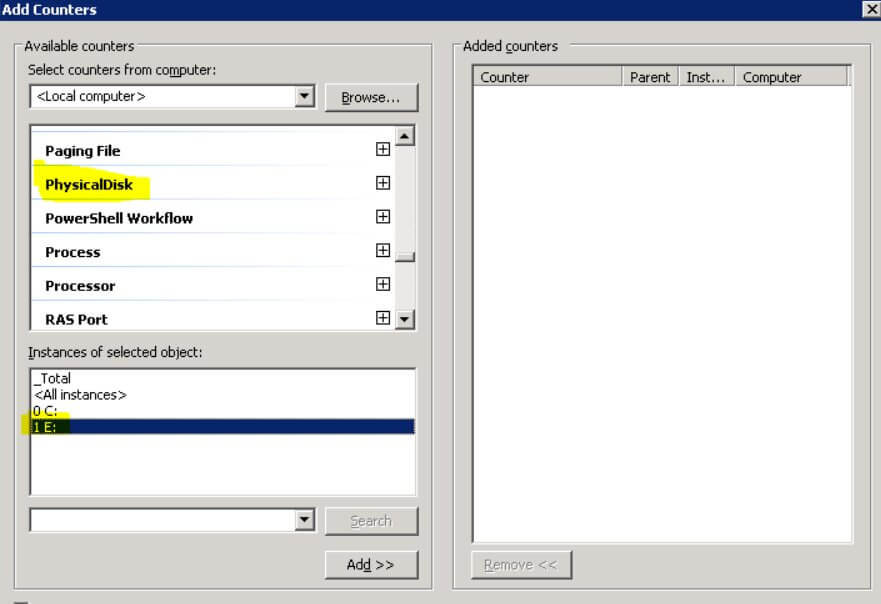
Note: Here you will be able to select the particular instance which you want to monitor. By default, it will select as Total. (For Windows Server 2003 and 2008 R2 have separate graphical user interfaces).
For example, in this article, we select the below four counters. Do not forget to click on Add after selecting each one.
Avg. Disk sec/Transfer
Disk Bytes/sec
Disk Transfers/sec
Avg. Disk Bytes/Transfer
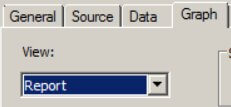
If you would like to view the current values only, then you can change the “view” from Line to Report in the graph tab.
You get the actual values as below:
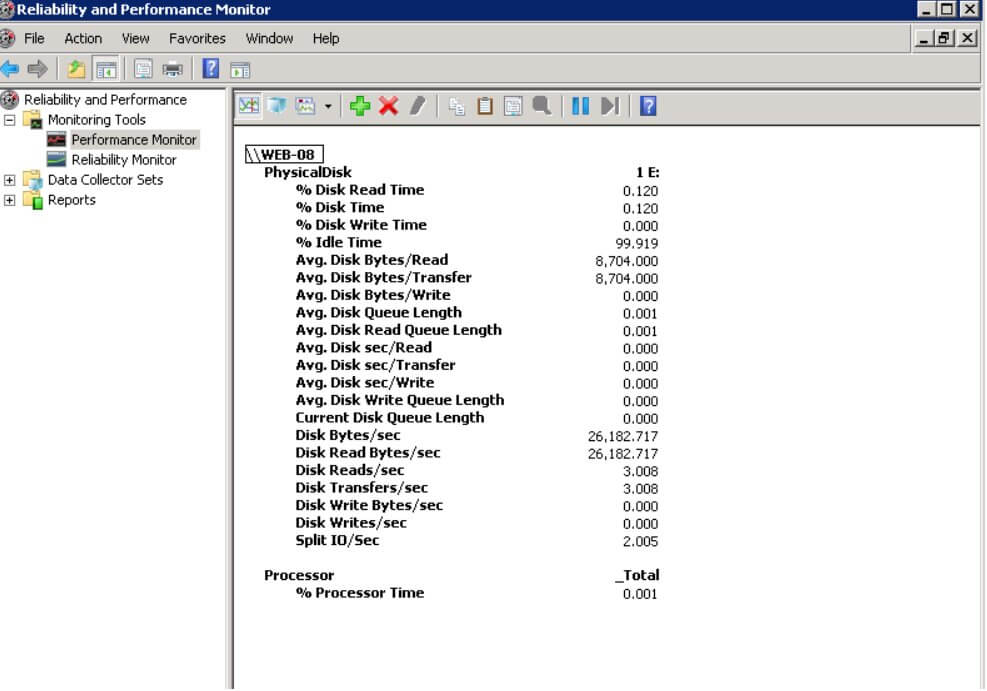
Here, the Avg. Disk Bytes/Transfer gives the IO Size, Avg. Disk sec/Transfer is linked to Average Latency, Disk Bytes/sec is the same as Throughput and last Disk Transfers/sec is IOPS.
Some important points:
- Latency is stated in milliseconds and this performance tool gives you the values in seconds, so change accordingly for e.g. 0.020 sec = 20 ms.
- IOPS is expressed in MB/sec, Windows 2003 shows values in Bytes/second. Convert them as 1Byte/sec = 1e-6 MB/sec.
After analyzing and monitoring the disk IO utilization, you can early locate the potential causes of storage subsystem failures and can reduce the risk of downtime. Also, you can plan accordingly for system upgrades in advance.